I started this blog with my thoughts on trading, and then let it rot for a while given I was caught up in a lot with work, a big move and a growing family. I feel bad, as every trader should have a journal to keep themselves in check. This blog was meant to be that journal, and for you to read if you feel like it!
So anyway, I’ll try to get back to it, and I will change direction slightly to cover my trading in my two accounts, rather than go through everything I’ve learned in a theoretical sense.
Cast Your Net
Almost every day I’ve been running a filter that shows me potential breakouts on US stocks. It’s not perfect, but I cast the net a little wider open to make sure I catch all the goodies while letting in a few oddities. The Amibroker-coded filter basically performs the following:
- Verifies overall market conditions
- Verifies the stocks are in what Minervini describes as Stage 2, which means they have emerged from being range-bound and are now trending upwards
- Verifies the stocks are close enough to their all-time-highs but not over-extended
- I then try my best to filter out ‘weird’ stocks, such as those with minute or extreme volatility, are illiquid, etc.
- They are systematically ranked as well, however I’m still not satisfied with it’s results to bother publishing. For now I do this by eye and also check IBD SmartSelect ranking, but only the technical ones: Relative Strength, Group Relative Strength and Accumulation/Distribution.
This gives me a decent amount of charts per day to review, without inundating myself with 1000s of stocks to review by eye per day. What’s interesting is the health of the market can be indirectly measured via the breadth of stocks that make it through the filter. Ugly weeks bring few opportunities (0-5), while since the Trump rally, the average daily cull has been much greater (10-100).
Portfolio Status
In any case, here is my current RRSP portfolio, which was started mid-September, 2016:
| BuyDate | Ticker | BuyPrice | InitStop | Stop | Close | R at risk | Profit R | Profit % |
| 2016/09/15 | FNSR | $28.11 | $25.50 | $25.18 | $33.75 | 3.2 | 2.2 | 20.0% |
| 2019/09/20 | NVDA | $63.87 | $58.76 | $85.74 | $107.23 | 4.2 | 8.5 | 67.8% |
| 2016/11/10 | OSK | $61.00 | $51.00 | $55.65 | $68.16 | 1.3 | 0.7 | 11.7% |
| 2016/11/10 | WAL | $40.99 | $36.00 | $38.86 | $49.61 | 2.2 | 1.7 | 21.0% |
| 2016/12/06 | PLAY | $49.18 | $44.50 | $44.51 | $58.19 | 2.9 | 1.9 | 18.3% |
| 2017/01/06 | SHOP | $47.00 | $40.00 | $41.08 | $61.52 | 2.9 | 2.1 | 30.8% |
| 2017/01/09 | TSRO | $145.93 | $125.00 | $127.33 | $190.36 | 3.0 | 2.1 | 30.4% |
| 2017/01/20 | NFLX | $139.44 | $123.40 | $108.68 | $142.22 | 1.2 | 0.2 | 2.0% |
| 2017/01/26 | AGX | $76.20 | $64.54 | $56.49 | $71.20 | 0.6 | -0.4 | -6.6% |
| 2017/02/06 | BEAT | $24.00 | $21.00 | $17.66 | $24.95 | 1.3 | 0.3 | 3.9% |
… and here’s the LIRA, which started mid-January of this year:
| BuyDate | Ticker | BuyPrice | InitStop | Stop | Close | R at risk | Profit R | Profit % |
| 2017/01/17 | AAOI | $28.89 | $25.00 | $24.73 | $37.27 | 3.2 | 2.1 | 28.9% |
| 2017/01/19 | BBD-B.TO | $2.61 | $2.50 | $2.50 | $2.53 | 0.3 | -0.9 | -3.8% |
| 2017/01/19 | CGNX | $67.46 | $57.96 | $51.59 | $76.44 | 1.9 | 0.9 | 13.3% |
| 2017/01/19 | SYMC | $26.45 | $24.83 | $21.48 | $28.80 | 2.5 | 1.4 | 8.8% |
| 2017/01/20 | AGO | $39.91 | $34.83 | $30.22 | $41.01 | 1.2 | 0.2 | 2.7% |
| 2017/01/20 | MIME | $22.75 | $18.32 | $16.77 | $19.54 | 0.3 | -0.7 | -14.2% |
| 2017/01/20 | NFLX | $139.44 | $123.40 | $108.68 | $142.22 | 1.2 | 0.2 | 2.0% |
| 2017/01/20 | TMUS | $60.54 | $54.30 | $46.67 | $63.92 | 1.5 | 0.5 | 5.5% |
| 2017/01/23 | IIVI | $31.10 | $28.63 | $27.99 | $39.00 | 4.2 | 3.2 | 25.3% |
| 2017/02/15 | SFBS | $41.98 | $38.07 | $30.34 | $41.87 | 1.0 | 0.0 | -0.3% |
As you can see, this bull market is very strong and seems very amenable to long-term trend-following (for now!). However this has been after an autumn of stagnation and some ugly reversals. In any case, both portfolios are decently profitable given their lifespan, giving me some hope that 2017 will be more similar to 2013 than the years that came after it.
Weekend Filter
Running my filter on Sunday, February 19th, gave the following results:
| Ticker | Sector | Industry |
| LOPE | Consumer Discretionary | Diversified Consumer Services |
| CBS | Consumer Discretionary | Media |
| LBAI | Financials | Banks |
| STL | Financials | Banks |
| CATY | Financials | Banks |
| CBSH | Financials | Banks |
| BRKL | Financials | Banks |
| TRMK | Financials | Banks |
| CME | Financials | Capital Markets |
| COF | Financials | Consumer Finance |
| KRNY | Financials | Thrifts & Mortgage Finance |
| WAFD | Financials | Thrifts & Mortgage Finance |
| NWBI | Financials | Thrifts & Mortgage Finance |
| XNCR | Health Care | Biotechnology |
| LNTH | Health Care | Health Care Equipment & Supplies |
| TBPH | Health Care | Pharmaceuticals |
| BA | Industrials | Aerospace & Defense |
| ITW | Industrials | Machinery |
| UNP | Industrials | Road & Rail |
| COMM | Information Technology | Communications Equipment |
| ANET | Information Technology | Communications Equipment |
| CGNX | Information Technology | Electronic Equipment, Instruments & Components |
| GOOG | Information Technology | Internet Software & Services |
| SWKS | Information Technology | Semiconductors & Semiconductor Equipment |
| AVGO | Information Technology | Semiconductors & Semiconductor Equipment |
As usual, since this Trump rally gave birth, financials are killing it. They are a daily occurrence in my filters as they continue to break new ground. Information Technology is another hot sector. This is also reflected in my portfolio. The stocks doing very well seems to be in either of these two categories. Also 26 stocks is a pretty large output for this filter, signifying strength in the markets.
Charts
Here are some marked-up charts I find interesting to close out this post.
New Ideas
Here are some definitely possible buys: $LBAI (financial) and $LOPE (for profit education), although the latter suffered a harsh fade after a fantastic gap-up. Early-stage gaps can net you solid returns, even better if you catch it before (as you’ll see with $PLAY below)!


Portfolio Angels
Here are my portfolio angels for the week:
$WAL (a bank, that’s all I know) breaks out of a flat base, glad I held onto it (my stop is nowhere near the price action anyway). Financial stocks just continue to impress:

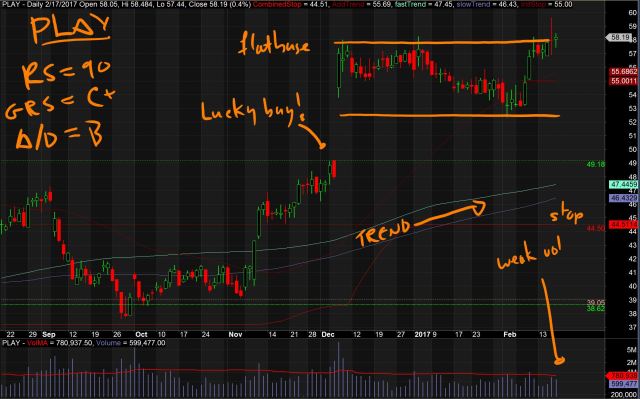
$PLAY (Dave and Buster’s, basically Chuck-e-Cheese for adults) breaks out of its flat base after a nice gap (one in which I magically bought the day before!). Volume is light and the breakout is not so convincing, but the price is moving up, that is what’s important.
$SHOP has just been awesome since it broke out of its long-term range with a high of 45$. It’s also a recent IPO and has a lot of hype after appearing on Dragon’s Den (Canadian Shark Tank). This thing has just been a diagonal line since.

Other nice moves of the week for my stocks include $TSRO, $CGNX, $TMUS.


Portfolio Duds
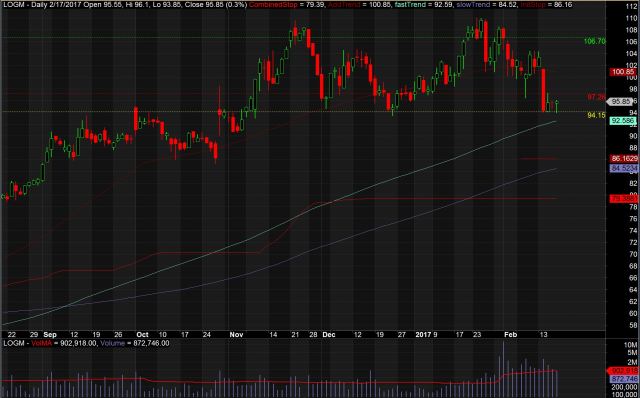
$LOGM is a dud I had to sell this week. It slammed through my stop, but seems to now be getting support at the 150 day simple moving-average. If it breaks out again and I have the capital, I may buy.
Never forget a stock that stopped you out previously! Take the case of NVDA, I bought it once at 33.74 and quickly got stopped out at 30.67. Then I tried again at 40.77 and sold it at 58.76, and only because I was reorganizing my accounts and had to sell everything. I kept my eye out on it, and then bought again at 64.50 and have been holding since. That’s a potential compounded return of 117%! If I would’ve forgotten about it, I would have just lost that initial 10% or so.

That’s it for now!
Terminology
Some key terms if you’re not familiar:
“R” = You’ll see “R at risk” or “Profit R” from my holdings indicate how many multiples of my original risk for which I’m up (or down). So if I bought a stock at 100$ with a stop loss at 90$, if the stock is at 120$, the R-multiple is calculated as such: (120-100)/(100-90) = 20/10 = 2 R. I got this idea from Van Tharp like most others, here is a good read on it.
RS = IBD’s relative strength measurement, which ranks stocks against all other stocks. Not to be confused with the similarly-named Relative Strength Line, which compares the stock action to the S&P500.
GRS = IBD’s Group RS, which ranks industry groups against each other. A good chunk of a stock’s strength relies on the performance of its industry and sector.
A/D = Accumulation/Distribution, as measured by IBD. Indicates how heavy the buying or selling is of a stock over the last 13-weeks.

You actually make it appear so easy with your presentation but I in finding this matter to be actually something that I think I’d never understand. It seems too complicated and extremely huge for me. I am looking ahead for your next put up, I will try to get the cling of it!
LikeLike
I am not certain where you are getting your information, however great topic. I must spend some time studying more or figuring out more. Thanks for great information I was on the lookout for this information for my mission.
LikeLike